It's time for our annual state of newsletters report. This is the 5th consecutive year I've written these reports covering the trends in the newsletter space based on InboxReads data. This data includes newsletters that cover a variety of topics and email service providers like Substack, beehiiv, Ghost, and Mailchimp.
In 2024, newsletters have continued to grow in popularity not just with independent writers but with large media companies all seeing email newsletters as a significant part of their distribution strategy.
Newsletter Topics

The most popular topics covered by the newsletter submissions received this year were the usual suspects: tech, business, and startups. A.I. has continued to be a really popular topic for newsletters making up 4% of submissions after only entering the top 20 topics for the first time last year.
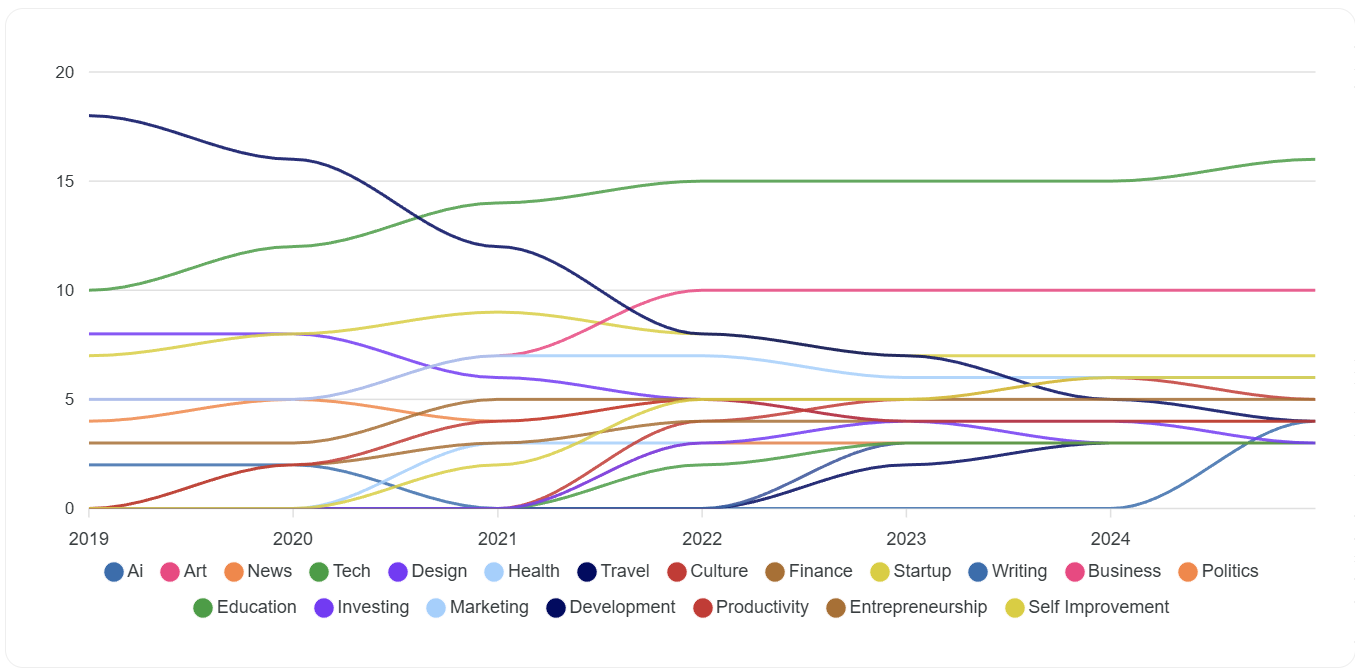 Here you can see how the most popular topics for newsletter submissions have changed over the years. Tech has become more popular rising to 16% of submissions. Software development newsletters have continued to decline to only 4% of submissions. Business newsletters have stayed consistent at 10%. There weren't any new topics surging to the top 10 this year like A.I. did last year.
You can find more data on newsletter topics in our topic section.
User Interests
The newsletter topics InboxReads visitors are interested in have always differed greatly from the submitted newsletters.
 This year sports and gaming were tied for the #1 topics of interest. The interest in every topic has remained pretty evenly spread out. It continues to show that there's still room for more newsletters covering a wider range of topics than what most creators are working on.
Last year self-improvement and Rust were all in the top 10 but this year they've been replaced by fitness and sex. If you're thinking about a newsletter in either category, now's the time!
Email Service Providers
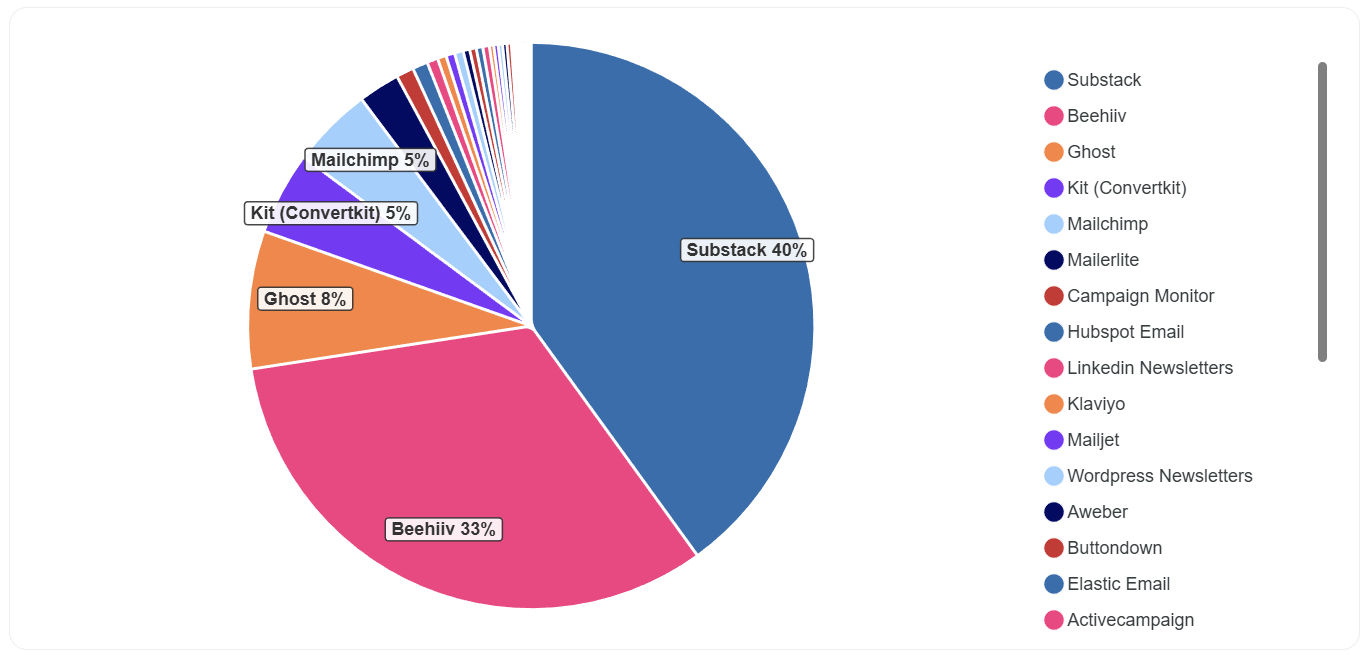 Substack remained the most popular email service provider for newsletter creators making up 40% of submissions. But beehiiv has continued its growth into the #2 spot with 33% of submissions. It'll be interesting see if it surpasses Substack next year.
Ghost, Kit (formerly Convertkit), and Mailchimp make up the rest of the top 5 with all other ESPs trailing far behind.
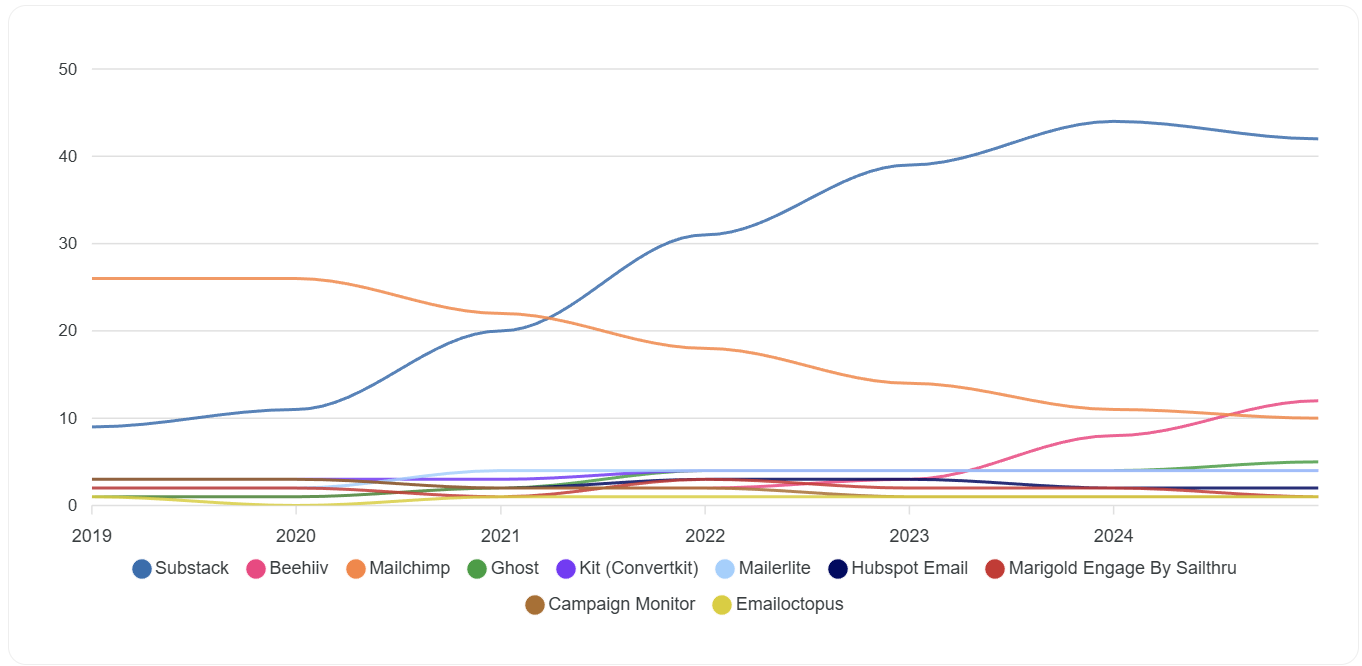
As for overall newsletters on InboxReads, Substack remains number one at 42% of all newsletters. beehiiv is still second but at only 12%, which is still impressive considering it's only been around for a few years.
Mailchimp has continued to decline and now makes up only 10% of newsletters. As more specialised email service providers for newsletters have emerged it makes sense that fewer writers turn to Mailchimp which is targeted to general email marketing.
Ghost has grown slightly from 4% to 5%. it's always great to see an independent and open-source product doing well with less resources. The other services have all maintained their positions from previous years.
How Long Did They Survive?
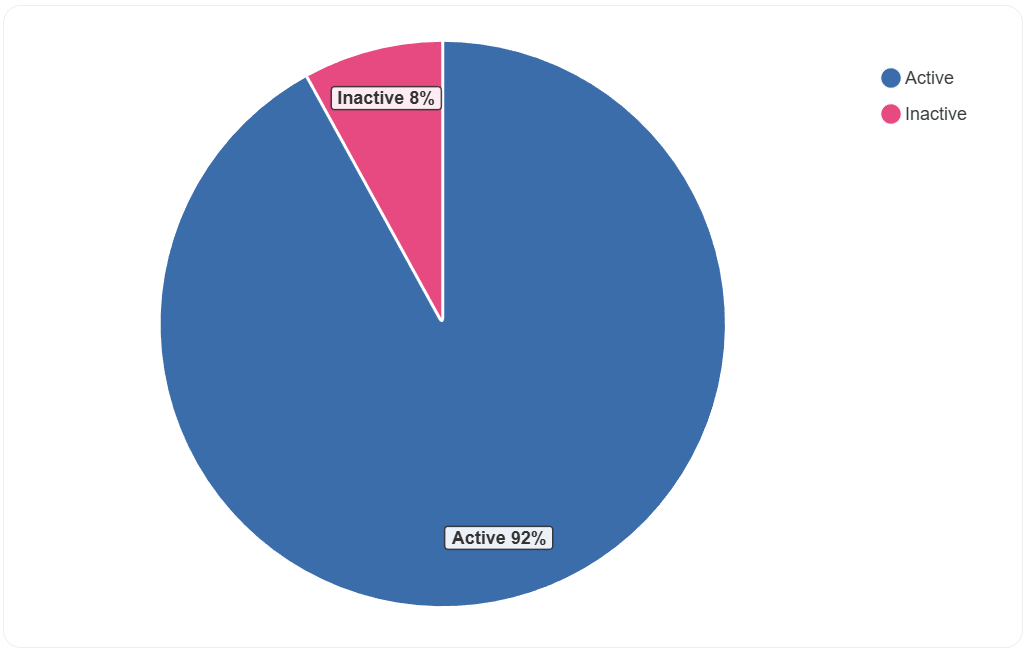 Of the submissions launched this year 8% were already inactive by the time of writing. Last year this was 8.8% of submissions so the trend of previous years continues. This might be the baseline for how many newsletters launched survive for a full year.
Sending rates

Weekly sending continues to be the most popular rate for newsletters at 51%. Daily newsletters are 2nd at 21% and monthly sending is the least popular at only 6%.
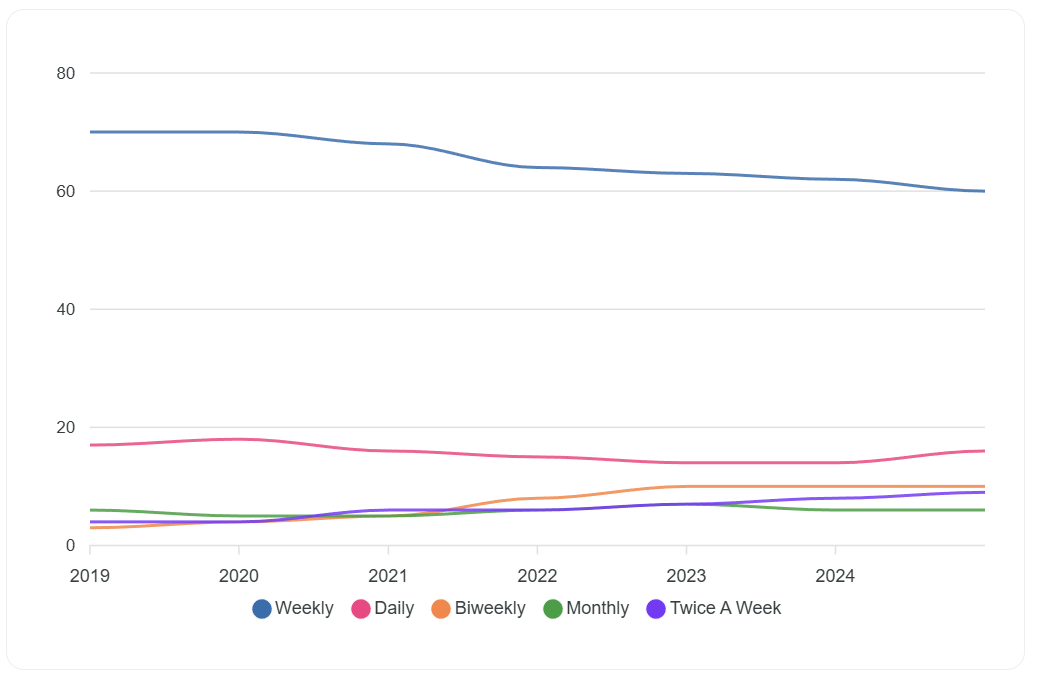 Over the years weekly sending has declined gradually, it now makes up just 60% of newsletters. Biweekly and twice-a-week newsletters have grown noticeable in recent years. Writers continue to experiment with sending rates that work best for their content.
Monetization

The percentage of paid newsletters submitted this year was just 2%. Newsletters with paid upgrades made up 12% of submissions. Overall it's an increase from 13.5% to 14% for the newsletters using subscriptions to monetize.
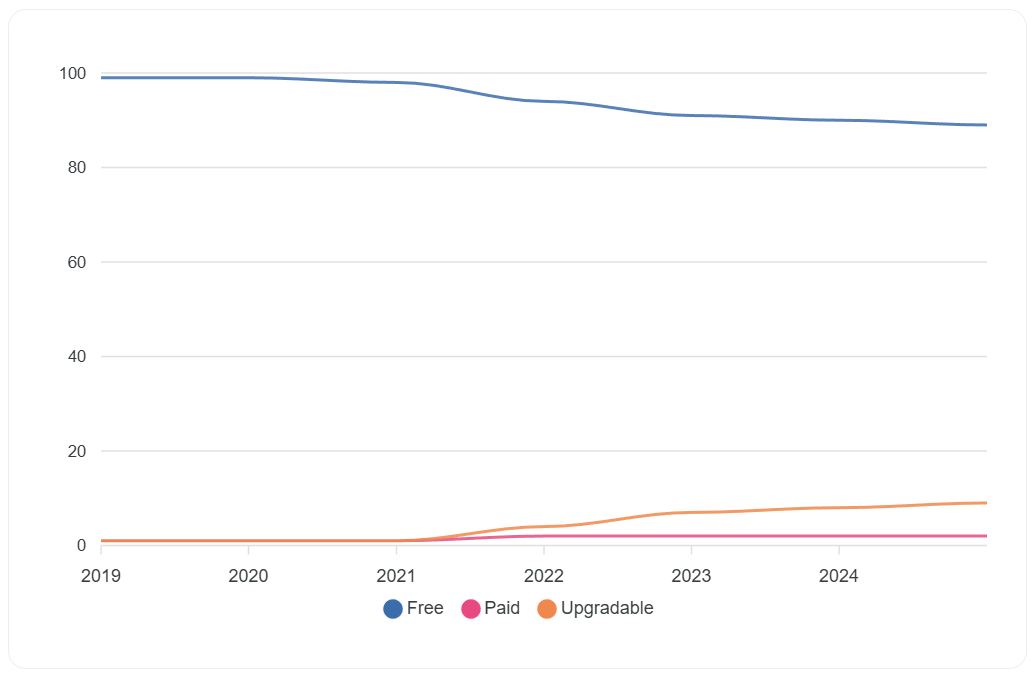
The percentage of paid and upgradable newsletters has grown over the years. But it still makes up a relatively small number of the newsletters on InboxReads.

72% of newsletters submitted this year were interested in sponsorships and ads. It's an increase from last year's 67%. Sponsorships continue to be the most popular form of monetization for newsletters.
Cross Promotion

74% of newsletters submitted this year were interested in cross promotion. It's down from 81% last year. It's still a great way to market your newsletter for free but I wonder if this is a sign of a decrease in its effectiveness or popularity.
Language

This year non-English languages made up 2% of submissions, up from only 1.4% of submissions last year. French, Spanish, and Italian were the non-English languages submitted this year.
What's Next?
Most newsletter trends have continued in 2024 with few big surprises. Email service providers like beehiiv and Ghost continue to grow and it seems like Substack finally has a real competitor it should be worried about in beehiiv.
The topics people are interested in reading newsletters about remain incredibly diverse, highlighting the unmet demand in the space when viewed against the newsletters submitted. As I say every year, it's a great time to launch a newsletter that's not about tech or productivity.
Also this year there's also a fully interactive dashboard of these stats and more you can access. You can explore all InboxReads data and trends from 2018 to 2024 beyond what's been shared here.


